Tự động lấy và trực quan hóa dữ liệu giá tiền điện tử từ Binance với Python
· 5 min read

Giới thiệu
Trong bài viết này, chúng ta sẽ học cách sử dụng Python và thư viện CCXT để lấy dữ liệu giá tiền điện tử từ sàn Binance, sau đó phân tích và trực quan hóa dữ liệu này. Đây là kỹ năng quan trọng cho các nhà giao dịch và phân tích thị trường tiền điện tử.
1. Cài đặt và Cấu hình
1.1. Cài đặt các thư viện cần thiết
pip install ccxt pandas numpy plotly openpyxl
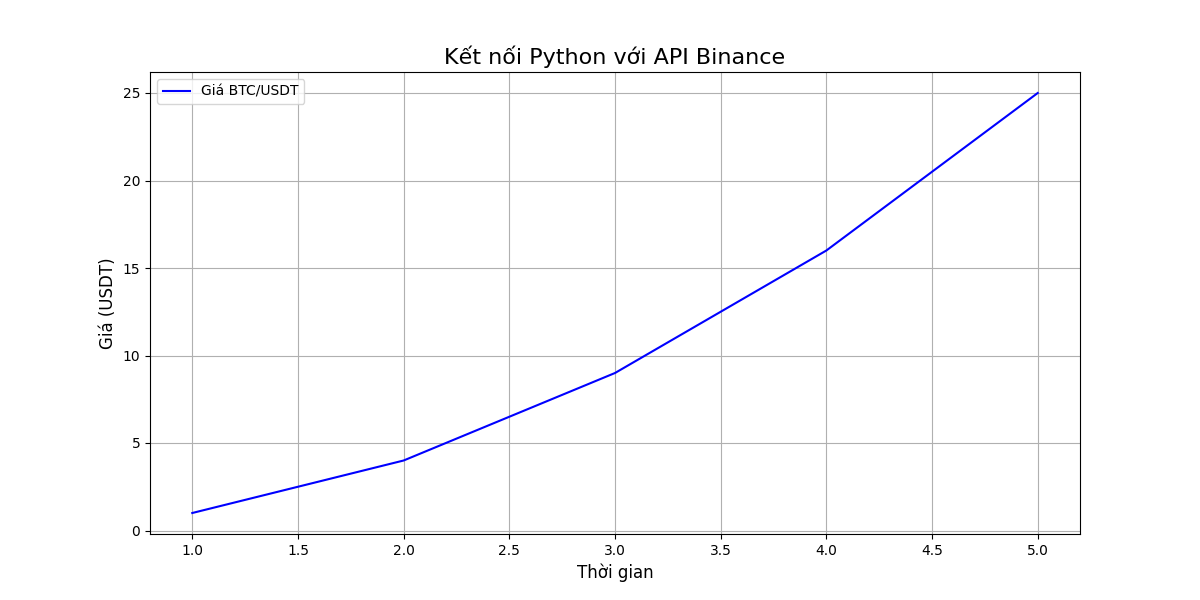
1.2. Kết nối với Binance qua CCXT
import ccxt
import pandas as pd
import plotly.graph_objects as go
from datetime import datetime

# Khởi tạo exchange
exchange = ccxt.binance({
    'enableRateLimit': True,  # Tự động xử lý rate limit
    'options': {
        'defaultType': 'spot'  # Sử dụng spot trading
    }
})

# Kiểm tra kết nối
print(f"Exchange: {exchange.name}")
print(f"Markets: {len(exchange.markets)}")
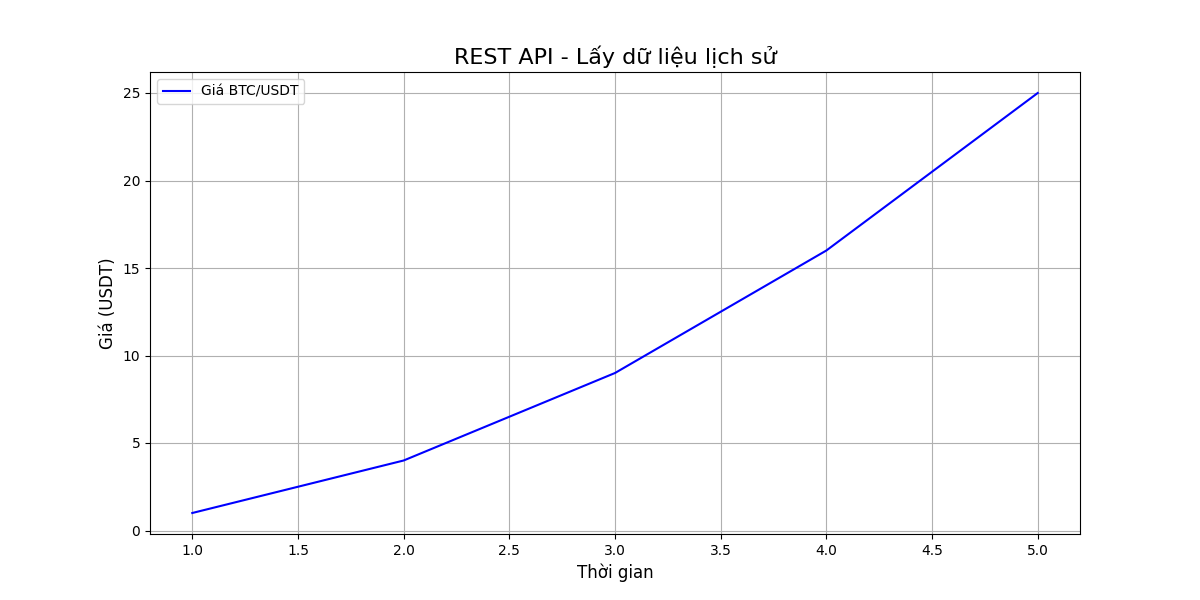
2. Lấy dữ liệu OHLCV (Candlestick)
2.1. Lấy dữ liệu theo timeframe
def fetch_ohlcv(symbol, timeframe='1h', limit=1000):
    """
    Lấy dữ liệu OHLCV từ Binance

    Parameters:
    - symbol: Cặp giao dịch (ví dụ: 'BTC/USDT')
    - timeframe: Khung thời gian ('1m', '5m', '1h', '4h', '1d')
    - limit: Số lượng nến muốn lấy (tối đa 1000)
    """
    try:
        ohlcv = exchange.fetch_ohlcv(symbol, timeframe, limit=limit)
        df = pd.DataFrame(ohlcv, columns=['timestamp', 'open', 'high', 'low', 'close', 'volume'])
        df['timestamp'] = pd.to_datetime(df['timestamp'], unit='ms')
        return df
    except Exception as e:
        print(f"Error fetching data: {e}")
        return None

# Ví dụ sử dụng
btc_data = fetch_ohlcv('BTC/USDT', '1h', 1000)
print(btc_data.head())
2.2. Lấy nhiều hơn 1000 nến
def fetch_multiple_ohlcv(symbol, timeframe='1h', since=None, limit=1000):
    """
    Lấy nhiều hơn 1000 nến bằng cách sử dụng since parameter
    """
    all_ohlcv = []
    while True:
        try:
            ohlcv = exchange.fetch_ohlcv(symbol, timeframe, since=since, limit=limit)
            if len(ohlcv) == 0:
                break
            all_ohlcv.extend(ohlcv)
            since = ohlcv[-1][0] + 1
        except Exception as e:
            print(f"Error: {e}")
            break
    return pd.DataFrame(all_ohlcv, columns=['timestamp', 'open', 'high', 'low', 'close', 'volume'])
3. Xử lý và Lưu trữ Dữ liệu
3.1. Xử lý dữ liệu với Pandas
def process_ohlcv_data(df):
    """
    Xử lý dữ liệu OHLCV
    """
    # Chuyển đổi timestamp
    df['timestamp'] = pd.to_datetime(df['timestamp'], unit='ms')

    # Tính toán các chỉ báo
    df['returns'] = df['close'].pct_change()
    df['volatility'] = df['returns'].rolling(window=20).std()

    # Tính toán SMA
    df['SMA20'] = df['close'].rolling(window=20).mean()
    df['SMA50'] = df['close'].rolling(window=50).mean()

    return df

# Xử lý dữ liệu
btc_data = process_ohlcv_data(btc_data)
3.2. Lưu trữ dữ liệu
def save_data(df, filename, format='csv'):
    """
    Lưu dữ liệu ra file
    """
    if format == 'csv':
        df.to_csv(f"{filename}.csv", index=False)
    elif format == 'excel':
        df.to_excel(f"{filename}.xlsx", index=False)
    elif format == 'html':
        df.to_html(f"{filename}.html", index=False)
    else:
        print("Unsupported format")

# Ví dụ lưu dữ liệu
save_data(btc_data, 'btc_data', 'csv')
save_data(btc_data, 'btc_data', 'excel')
4. Trực quan hóa dữ liệu với Plotly
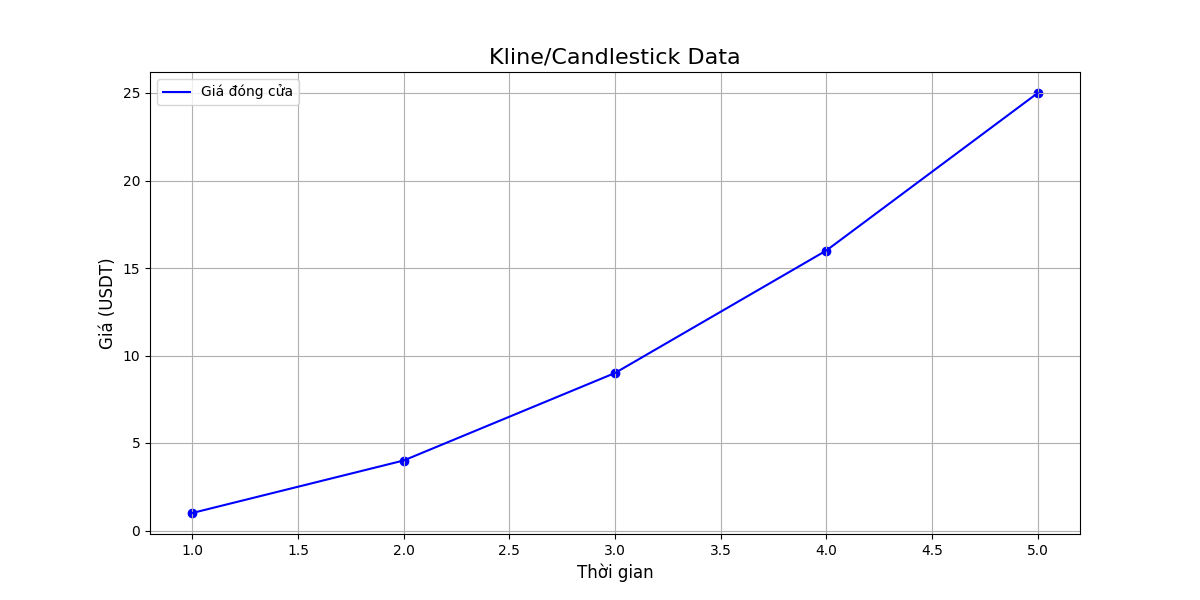
4.1. Vẽ biểu đồ nến (Candlestick)
def plot_candlestick(df, title='BTC/USDT Price'):
    """
    Vẽ biểu đồ nến với Plotly
    """
    fig = go.Figure(data=[go.Candlestick(
        x=df['timestamp'],
        open=df['open'],
        high=df['high'],
        low=df['low'],
        close=df['close']
    )])

    # Thêm SMA
    fig.add_trace(go.Scatter(
        x=df['timestamp'],
        y=df['SMA20'],
        name='SMA20',
        line=dict(color='blue')
    ))

    fig.add_trace(go.Scatter(
        x=df['timestamp'],
        y=df['SMA50'],
        name='SMA50',
        line=dict(color='red')
    ))

    # Cập nhật layout
    fig.update_layout(
        title=title,
        yaxis_title='Price (USDT)',
        xaxis_title='Date',
        template='plotly_dark'
    )

    return fig

# Vẽ và hiển thị biểu đồ
fig = plot_candlestick(btc_data)
fig.show()
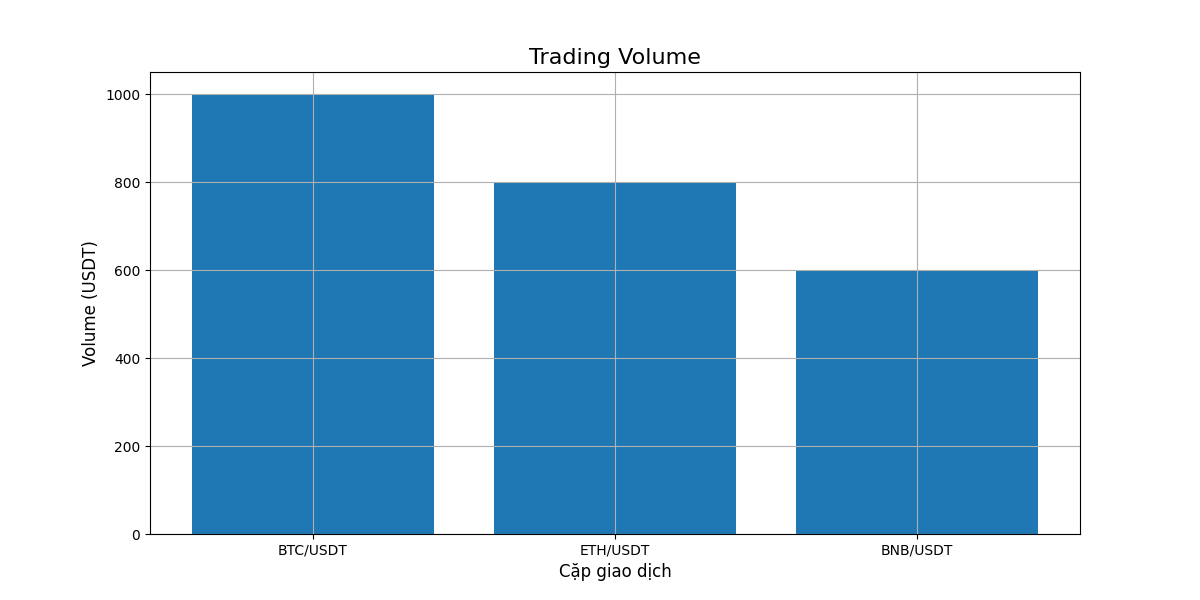
4.2. Vẽ biểu đồ volume
def plot_volume(df, title='BTC/USDT Volume'):
    """
    Vẽ biểu đồ volume
    """
    fig = go.Figure(data=[go.Bar(
        x=df['timestamp'],
        y=df['volume'],
        name='Volume'
    )])

    fig.update_layout(
        title=title,
        yaxis_title='Volume',
        xaxis_title='Date',
        template='plotly_dark'
    )

    return fig

# Vẽ và hiển thị biểu đồ volume
volume_fig = plot_volume(btc_data)
volume_fig.show()
5. Lấy giá hiện tại (Ticker)
def get_current_price(symbol):
    """
    Lấy giá hiện tại của một cặp giao dịch
    """
    try:
        ticker = exchange.fetch_ticker(symbol)
        return {
            'symbol': symbol,
            'last': ticker['last'],
            'bid': ticker['bid'],
            'ask': ticker['ask'],
            'volume': ticker['baseVolume'],
            'timestamp': datetime.fromtimestamp(ticker['timestamp']/1000)
        }
    except Exception as e:
        print(f"Error fetching ticker: {e}")
        return None

# Ví dụ lấy giá BTC/USDT
btc_ticker = get_current_price('BTC/USDT')
print(btc_ticker)
6. Mở rộng: Các tính năng nâng cao
6.1. Lấy dữ liệu từ nhiều cặp giao dịch
def fetch_multiple_symbols(symbols, timeframe='1h', limit=1000):
    """
    Lấy dữ liệu từ nhiều cặp giao dịch
    """
    data = {}
    for symbol in symbols:
        data[symbol] = fetch_ohlcv(symbol, timeframe, limit)
    return data

# Ví dụ lấy dữ liệu nhiều cặp
symbols = ['BTC/USDT', 'ETH/USDT', 'BNB/USDT']
multi_data = fetch_multiple_symbols(symbols)
6.2. Tính toán tương quan giữa các cặp
def calculate_correlation(data_dict):
    """
    Tính toán tương quan giữa các cặp giao dịch
    """
    # Tạo DataFrame với giá đóng cửa của các cặp
    closes = pd.DataFrame()
    for symbol, df in data_dict.items():
        closes[symbol] = df['close']

    # Tính toán ma trận tương quan
    correlation = closes.corr()
    return correlation

# Tính và hiển thị tương quan
correlation = calculate_correlation(multi_data)
print(correlation)
Kết luận
Trong bài viết này, chúng ta đã học cách:
- Kết nối với Binance qua CCXT
- Lấy và xử lý dữ liệu OHLCV
- Lưu trữ dữ liệu dưới nhiều định dạng
- Trực quan hóa dữ liệu với Plotly
- Thực hiện các phân tích nâng cao
Đây là nền tảng cơ bản để bạn có thể tự động hóa việc phân tích dữ liệu tiền điện tử. Bạn có thể mở rộng thêm bằng cách:
- Thêm các chỉ báo kỹ thuật
- Tạo chiến lược giao dịch tự động
- Phân tích sentiment từ social media
- Tích hợp với các nguồn dữ liệu khác
Tài liệu tham khảo
Liên hệ
Nếu bạn có thắc mắc hoặc cần hỗ trợ thêm, hãy liên hệ:
- Email: support@huongnghiepdulieu.com
- GitHub: huongnghiepdulieu