The Man Who Solved the Market - Khi Dữ Liệu Trở Thành Vũ Khí Giao Dịch

Nếu Warren Buffett được xem là biểu tượng của đầu tư giá trị, thì Jim Simons - nhà toán học, nhà khoa học và nhà sáng lập quỹ Renaissance Technologies - lại được mệnh danh là người đưa toán học và dữ liệu vào thị trường tài chính, khởi đầu cho cuộc cách mạng định lượng (Quant Revolution). Cuốn "The Man Who Solved the Market" của Gregory Zuckerman không chỉ là tiểu sử của một thiên tài, mà còn là bản thiết kế cho tương lai của algorithmic trading.
📘 Giới thiệu
Cuốn sách
The Man Who Solved the Market: How Jim Simons Launched the Quant Revolution
Tác giả: Gregory Zuckerman
Xuất bản: 2019
Thể loại: Business Biography, Finance, Quantitative Trading
Synopsis:
Cuốn sách kể câu chuyện về Jim Simons, người đã chuyển từ một giáo sư toán học trở thành nhà đầu tư thành công nhất trong lịch sử. Khác với Warren Buffett hay George Soros dựa vào trực giác và phân tích kinh tế, Simons tin rằng thị trường có thể được giải mã bằng toán học và dữ liệu.
Với quỹ Medallion Fund của Renaissance Technologies, ông đạt lợi nhuận trung bình 66% mỗi năm từ 1988-2018, trước cả phí quản lý - một kỷ lục chưa từng có và chưa bao giờ bị phá vỡ.
Tại sao cuốn sách quan trọng?
Trong thời đại:
- AI và Machine Learning đang thống trị mọi ngành
- Crypto trading bots đang trở nên phổ biến
- Retail investors có thể access công cụ quant trading
- Big Data và algorithmic trading không còn là đặc quyền của institutions
Bài học từ Jim Simons trở nên cực kỳ relevant cho mọi trader/investor hiện đại.
🔬 Jim Simons - Từ Toán Học Đến Tài Chính
Early Life & Career
1938: Sinh tại Massachusetts, USA
Giáo dục:
- BS toán học, MIT (1958)
- PhD toán học, UC Berkeley (1961)
- Chuyên ngành: Hình học vi phân và lý thuyết đại số
Academic Career:
1961-1964: Giảng viên MIT
1964-1968: Harvard, Princeton
1968-1978: Chủ nhiệm khoa Toán, Stony Brook University

Thành tựu academic:
- Chern-Simons theory (vật lý lý thuyết)
- Oswald Veblen Prize (1976)
- Geometry Hall of Fame
NSA Period (1964-1968):
- Làm codebreaker cho National Security Agency
- Áp dụng toán học vào cryptography
- Học cách tìm patterns trong noise
Chuyển Sang Tài Chính
1978: Thành lập Monemetrics (sau đổi tên Renaissance Technologies)
Why finance?
Jim Simons nhận ra:
"Thị trường tài chính giống như một hệ thống vật lý phức tạp.
Nếu có đủ dữ liệu và công cụ toán học phù hợp, bạn có thể tìm ra quy luật."
Triết lý core:
- Thị trường KHÔNG hoàn toàn ngẫu nhiên
- Có patterns lặp lại trong noise
- Toán học có thể khai thác những patterns này
- Cảm xúc con người là kẻ thù lớn nhất
Renaissance Technologies
Founded: 1982
Location: East Setauket, New York (xa Wall Street!)
AUM: $130 billion+ (2023)
Unique approach:
- Không tuyển traders hay MBAs
- Chỉ tuyển: Mathematicians, Physicists, Computer Scientists
- Văn hóa "academic" - giống MIT hơn hedge fund
- Cực kỳ secretive (không công bố strategies)
Medallion Fund:
- Launched: 1988
- Returns: 66% average annual (before fees), 39% after fees
- Only available to employees
- Closed to outside investors since 1993
- Best performing fund in history
Comparison với legends:
| Manager | Fund | Annual Return (avg) | Period |
|---|---|---|---|
| Jim Simons | Medallion | 66% (before fees) | 1988-2018 |
| Warren Buffett | Berkshire Hathaway | 20% | 1965-2023 |
| George Soros | Quantum Fund | 30% | 1969-2000 |
| Peter Lynch | Magellan | 29% | 1977-1990 |
| Ray Dalio | Pure Alpha | 12% | 1991-2023 |
Medallion Fund performance:
$1 invested in 1988 → $40,000+ by 2018
(vs S&P 500: $1 → $20)

Compound growth: 2000X in 30 years!
⚙️ Cuộc Cách Mạng Định Lượng (Quant Revolution)
Trước Jim Simons
Traditional trading mindset (1970s-1980s):
"Markets are driven by fundamentals"
→ Study financial statements
→ Meet management teams
→ Understand macro economics
→ Trust your gut feeling
Assumptions:
- Human intuition is valuable
- Qualitative analysis matters
- Experience beats models
- You can "understand" why stock moves
Icons:
- Warren Buffett (value investing)
- Peter Lynch (growth investing)
- George Soros (macro investing)
Simons' Paradigm Shift
New mindset:
"Markets are noisy data streams"
→ Collect massive amounts of data
→ Find statistical patterns
→ Build predictive models
→ Let algorithms decide
Key insights:
-
Markets are partially predictable
- Not 100%, but enough edge to profit
- Tiny edges, compounded over many trades = huge returns
-
Patterns exist in price data
- Not obvious to human eye
- Require statistical analysis to uncover
- Can be fleeting (milliseconds to days)
-
Emotions are the enemy
- Fear and greed distort judgment
- Computers don't panic or get greedy
- Discipline > Intuition
-
Speed matters
- Execute trades in milliseconds
- Humans too slow
- Automation is mandatory
The Quant Approach
Renaissance methodology:
Step 1: Data Collection
Everything is data:
- Price & volume (tick-by-tick)
- Order book depth
- News & social sentiment
- Economic indicators
- Weather data
- Satellite imagery
- Alternative data (credit cards, web traffic, etc.)
Step 2: Pattern Recognition
# Simplified example (real models are FAR more complex)

import numpy as np
from sklearn.ensemble import RandomForestClassifier

# Features from price data
features = [
    'price_change_1h',
    'volume_change_1h',
    'volatility',
    'order_book_imbalance',
    'momentum_indicator',
    # ... 1000s more features
]

# Train model to predict: up/down/neutral
model = RandomForestClassifier(n_estimators=1000)
model.fit(X_train, y_train)

# Model finds patterns humans can't see
predictions = model.predict(X_test)
Step 3: Backtesting
Test strategy on historical data:
- Does edge persist over time?
- What's the Sharpe ratio?
- Maximum drawdown?
- Transaction costs impact?

If strategy profitable on backtest → Deploy
Step 4: Live Trading
Automated execution:
- No human intervention
- Real-time position management
- Risk controls built-in
- Continuous monitoring
Step 5: Iteration
Markets evolve → Models must adapt
- Re-train models regularly
- Add new data sources
- Refine features
- Abandon strategies that stop working
Competitive Advantages
Why Renaissance dominated:
1. Talent
- Hired the smartest mathematicians globally
- PhDs from MIT, Stanford, Princeton
- Experience in cryptography, physics, NLP
- Paid top dollar for top minds
2. Data
- Started collecting data in 1980s
- Decades of proprietary datasets
- Cleaned, normalized, structured
- Competitors started 10+ years behind
3. Technology
- Built custom supercomputers
- Low-latency execution systems
- Proprietary programming languages
- Constant R&D investment
4. Culture
- Academic environment (not Wall Street)
- Collaboration > Competition internally
- Long-term thinking
- Secrecy (no leaking of strategies)
5. Compounding
- Reinvesting profits
- Snowball effect on resources
- More data → Better models → More profits → More investment
💰 Khi Dữ Liệu Trở Thành Lợi Thế Cạnh Tranh
The Data Obsession
Jim Simons' belief:
"We don't predict the future.
We just find the highest probability of repeating behaviors."
Data philosophy:
Traditional: "Why is this stock moving?"
Renaissance: "What patterns precede this move?"

Traditional: "Understand the company"
Renaissance: "Understand the data"

Traditional: "Quality over quantity"
Renaissance: "Both quality AND quantity"
Data Sources Used
Market data:
- Every tick for every instrument
- 40+ years of historical data
- Bid/ask spreads
- Order flow
- Trade size distributions
Alternative data:
- News sentiment (before it was cool)
- Weather patterns (commodities impact)
- Satellite imagery (parking lots, shipping)
- Credit card transactions
- Web scraping (product reviews, traffic)
- Social media (before Twitter existed)
Economic data:
- GDP, inflation, employment
- Interest rates
- Currency flows
- Commodity prices
Everything is correlated:
Example insights Renaissance might find:

"When US dollar strengthens by >0.5%
 AND oil prices drop >2%
 AND gold volatility spikes
 → Emerging market stocks likely to drop within 24h
 → Short EM equity futures"

"When corn prices rise during summer
 AND weather forecasts show drought
 → Food stocks tend to underperform
 → But fertilizer stocks outperform"
Signal Generation
Thousands of micro-signals:
Renaissance doesn't rely on one "big idea."
They combine thousands of tiny signals:
Signal 1: Moving average crossover (0.001% edge)
Signal 2: Volume spike pattern (0.0015% edge)
Signal 3: Order book imbalance (0.0008% edge)
...
Signal 5,000: Seasonal pattern (0.0012% edge)

Combined: Significant cumulative edge
Executed 100,000+ times/day = Massive profits
Example signals (simplified):
# Mean reversion signal
if price > moving_average_20 + 2*std_dev:
    signal = -1  # Sell (expect reversion)

# Momentum signal
if price_change_5d > 3% AND volume > avg_volume * 1.5:
    signal = +1  # Buy (momentum continuation)

# Combine signals with weights
final_signal = (
    0.3 * mean_reversion_signal +
    0.2 * momentum_signal +
    0.15 * volatility_signal +
    # ... 1000s more
)
Execution Excellence
Speed is alpha:
2000s: Execute in seconds
2010s: Execute in milliseconds
2020s: Execute in microseconds

Why? Signals decay fast
- First mover captures full edge
- Followers get crumbs
- Speed = Competitive advantage
Renaissance infrastructure:
- Co-located servers next to exchanges
- Direct market access (no brokers)
- Custom order routing algorithms
- Minimal latency (< 1ms execution)
Risk Management
Portfolio construction:
Don't bet everything on one signal

Diversification:
- Trade 1000s of instruments
- Hold 1000s of positions simultaneously
- Each position tiny (0.01-0.1% of portfolio)
- Uncorrelated bets

Result: Smooth returns, low volatility
Sharpe ratio: 2+ (vs market's 0.4)
Hedging:
Long/short market-neutral strategies
→ Don't need bull market to profit
→ Make money in any market condition
→ Hedged against systematic risk
Continuous monitoring:
- Real-time P&L tracking
- Automatic position sizing
- Kill-switch if something breaks
- Daily risk reports
🧩 Bài Học Cho Thế Hệ Nhà Đầu Tư Mới
1. Tư Duy Định Lượng Hơn Cảm Xúc
❌ Emotional trading:
"I feel like BTC is going up"
"Everyone is bullish, so I'm bullish"
"I lost money, let me revenge trade"
"This coin looks cheap!"
✅ Quantitative thinking:
"Backtest shows RSI < 30 + Volume spike = 65% win rate"
"Risk/reward ratio: 1:3, bet size: 2% of portfolio"
"Stop-loss at -5%, take-profit at +15%"
"Historical data: This setup wins 7/10 times"
How to shift:
-
Track everything:
- Every trade: Entry, exit, reason, outcome
- Build personal database
- Analyze what works, what doesn't
-
Backtest ideas:
- Before trading any "feeling", test it on historical data
- Use TradingView, Python, or Excel
- If backtest fails, don't trade it
-
Set rules, follow them:
- "I only buy when [X] AND [Y] conditions met"
- No exceptions, no "but this time is different"
- Discipline = Edge
-
Remove yourself:
- Use bots to execute strategies
- Eliminate emotional decisions
- Let data decide
2. Tự Động Hóa Là Tất Yếu
Why automation?
Humans:
- Get tired
- Make mistakes
- Panic in volatility
- Miss opportunities (sleep, work, etc.)
- Inconsistent execution

Bots:
- Never sleep (24/7 trading)
- Execute perfectly every time
- No emotions
- React in milliseconds
- Backtest-able
Modern tools available:
For stocks/forex:
- MetaTrader 4/5 (Expert Advisors)
- TradingView (Pine Script)
- Interactive Brokers (API)
- QuantConnect (Python algos)
For crypto:
- Bitget API
- 3Commas bots
- Cryptohopper
- Custom Python bots (CCXT library)
Simple bot example:
import ccxt

exchange = ccxt.bitget({
    'apiKey': 'YOUR_KEY',
    'secret': 'YOUR_SECRET',
})

def mean_reversion_strategy():
    # Get price data
    ohlcv = exchange.fetch_ohlcv('BTC/USDT', '1h', limit=100)
    prices = [x[4] for x in ohlcv]  # Close prices

    current_price = prices[-1]
    ma_20 = sum(prices[-20:]) / 20
    std = np.std(prices[-20:])

    # Signal: Buy if 2 std devs below MA
    if current_price < ma_20 - 2*std:
        exchange.create_market_buy_order('BTC/USDT', 0.01)
        print("BUY signal executed")

    # Signal: Sell if 2 std devs above MA
    elif current_price > ma_20 + 2*std:
        exchange.create_market_sell_order('BTC/USDT', 0.01)
        print("SELL signal executed")

# Run every hour
schedule.every().hour.do(mean_reversion_strategy)
3. Dữ Liệu Là Tài Sản
Data advantages:
More data = Better models
Better models = Better predictions
Better predictions = Higher returns
What data matters?
Price & volume:
- Historical OHLCV (Open, High, Low, Close, Volume)
- Tick data (every trade)
- Order book depth
On-chain (crypto):
- Wallet addresses
- Transaction volumes
- Exchange flows
- Active addresses
- Hash rate
Sentiment:
- Social media (Twitter, Reddit)
- News articles
- Google Trends
- Fear & Greed Index
Macro:
- Interest rates
- Inflation
- GDP growth
- Currency strength
How to collect:
# Example: Collect Twitter sentiment
import tweepy
from textblob import TextBlob

# Get tweets about BTC
tweets = api.search_tweets(q='Bitcoin', count=100)

# Analyze sentiment
sentiments = []
for tweet in tweets:
    analysis = TextBlob(tweet.text)
    sentiments.append(analysis.sentiment.polarity)

average_sentiment = sum(sentiments) / len(sentiments)

if average_sentiment > 0.2:
    print("Positive sentiment → Bullish signal")
elif average_sentiment < -0.2:
    print("Negative sentiment → Bearish signal")
Build your data moat:
-
Start collecting NOW
- Even if not using yet
- Data from 2025 valuable in 2030
-
Clean & organize
- Consistent format
- Handle missing values
- Normalize across sources
-
Automate collection
- APIs, web scraping
- Daily pipelines
- Cloud storage
-
Compound over time
- More history = Better backtests
- Unique datasets = Competitive edge
4. Diversification & Risk Management
Renaissance lesson:
Don't need to be right 100% of time
Just need to be right 51% of time
With proper risk management
Key principles:
Position sizing:
Never risk >1-2% per trade

Example:
Account: $10,000
Risk per trade: 1% = $100

If stop-loss is 5%:
→ Position size = $100 / 0.05 = $2,000
Diversification:
Don't put all eggs in one basket

- Trade multiple assets (BTC, ETH, SOL, etc.)
- Multiple strategies (trend, mean-reversion, momentum)
- Multiple timeframes (scalping, day trading, swing)
Kelly Criterion:
def kelly_criterion(win_rate, avg_win, avg_loss):
    """
    Optimal bet size formula
    """
    p = win_rate  # Probability of winning
    q = 1 - p     # Probability of losing
    b = avg_win / avg_loss  # Win/loss ratio

    kelly = (p * b - q) / b

    # Conservative: Use half Kelly
    return kelly * 0.5

# Example
win_rate = 0.60
avg_win = 10
avg_loss = 5

optimal_bet = kelly_criterion(0.60, 10, 5)
print(f"Bet {optimal_bet:.2%} of portfolio")
# Output: Bet 25% of portfolio (but use half = 12.5%)
5. Continuous Learning & Adaptation
Markets evolve:
What worked in 2020 may not work in 2025
Strategies decay over time
Must constantly adapt
Renaissance approach:
- Re-train models monthly
- Test new data sources
- Abandon failing strategies
- R&D never stops
Your approach:
-
Track performance:
- Which strategies winning/losing?
- Why? Market regime change?
- Adjust accordingly
-
Learn new techniques:
- Machine learning
- Advanced statistics
- New programming languages
- Stay updated with research
-
Test, test, test:
- Every new idea → Backtest first
- Paper trade before live
- Start small, scale gradually
-
Community:
- Join quant trading forums
- Share ideas (not secret sauce)
- Learn from others' mistakes
🚀 Kết Nối Với Thế Giới Hôm Nay
Jim Simons' Legacy in Modern Markets
Renaissance pioneered:
- High-frequency trading (HFT)
- Machine learning in finance
- Alternative data usage
- Systematic trading dominance
Now mainstream:
- 80%+ of US stock volume = algos
- Every major bank has quant teams
- Retail investors access same tools
- Crypto = New frontier for quant strategies
Quant Trading in Crypto
Perfect environment:
Why crypto ideal for quant trading:

1. 24/7 markets (no closing bell)
2. High volatility (more opportunities)
3. API access (easy automation)
4. Transparent data (on-chain)
5. Low barriers to entry (anyone can code bots)
6. Immature market (more inefficiencies)
Opportunities:
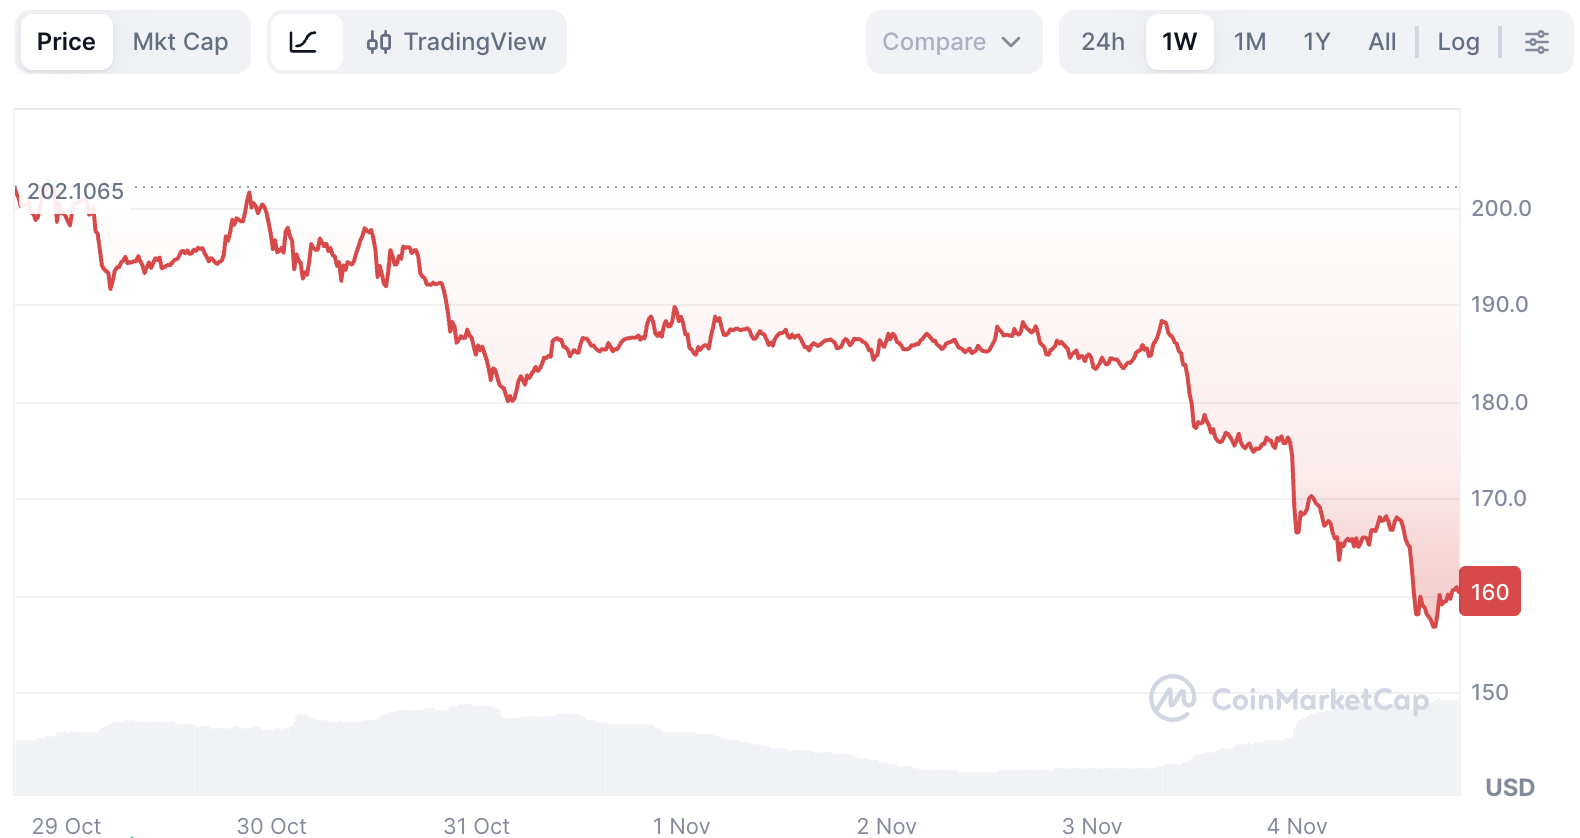
Arbitrage:
BTC price on Binance: $67,000
BTC price on Bitget: $67,100
→ Buy Binance, sell Bitget
→ Profit: $100 (0.15%)
→ Repeat 1000 times = $100,000

(Real arb more complex, but concept same)
Market making:
Place buy orders at $66,950
Place sell orders at $67,050
→ Capture spread ($100) when orders fill
→ Provide liquidity, earn fees
Trend following:
# Simple example
if price > MA_50 and MA_50 > MA_200:
    position = 'long'
elif price < MA_50 and MA_50 < MA_200:
    position = 'short'
else:
    position = 'neutral'
Mean reversion:
if (price - MA_20) / std > 2:
    # Overextended → sell
    position = 'short'
elif (price - MA_20) / std < -2:
    # Oversold → buy
    position = 'long'
Tools & Platforms
Learning & Development:
Python libraries:
pip install pandas numpy matplotlib
pip install ccxt  # Crypto exchange APIs
pip install ta-lib  # Technical analysis
pip install scikit-learn  # Machine learning
pip install backtrader  # Backtesting
Platforms:
- QuantConnect: Cloud quant platform (Python/C#)
- Quantopian: (Closed, but resources still valuable)
- TradingView: Pine Script strategies
- Backtrader: Python backtesting framework
- Zipline: Algorithmic trading library
Crypto APIs:
- Bitget API
- Binance API
- Coinbase Pro API
- CCXT (unified API for 100+ exchanges)
Data sources:
- CoinGecko API (free crypto data)
- Alpha Vantage (stocks, free tier)
- Yahoo Finance (historical data)
- Quandl (alternative data)
- Glassnode (on-chain data)
Phong Trào Quant Retail
Democratization of quant trading:
2000s:
- Only hedge funds & banks
- Expensive infrastructure
- Proprietary data
2020s:
- Anyone with laptop can start
- Free/cheap tools & data
- Online communities & education
Success stories:
r/algotrading: 200k+ members sharing strategies
QuantConnect: 100k+ users
GitHub: 1000s of open-source trading bots

Individuals earning 20-50%+ annual returns
Some even rival professional funds!
Challenges:
- High competition
- Need coding skills
- Risk of overfitting
- Execution costs matter
But opportunity:
- Crypto still inefficient
- Niche markets = Less competition
- Can start with $1000
- Learn as you earn
📚 Những Cuốn Sách Nên Đọc Thêm
Quant Trading Fundamentals
1. "Quantitative Trading" - Ernest P. Chan
Level: Beginner to Intermediate
Focus: Practical strategies, Python code
Best for: Getting started with algo trading
Key topics: Mean reversion, momentum, backtesting
2. "Algorithmic Trading" - Ernest P. Chan
Level: Intermediate
Focus: Advanced strategies, risk management
Best for: Scaling up from basics
Key topics: Portfolio optimization, execution
3. "Machine Learning for Algorithmic Trading" - Stefan Jansen
Level: Advanced
Focus: ML techniques for finance
Best for: Modern quant approaches
Key topics: Deep learning, NLP, alternative data
Advanced Quant Topics
4. "Advances in Financial Machine Learning" - Marcos López de Prado
Level: Expert
Focus: Cutting-edge research
Best for: Serious quants
Key topics: Feature engineering, meta-labeling, backtesting
5. "Quantitative Momentum" - Wesley Gray
Level: Intermediate
Focus: Momentum strategies
Best for: Long-term investors
Key topics: Factor investing, behavioral finance
6. "Flash Boys" - Michael Lewis
Level: Beginner (non-technical)
Focus: HFT industry story
Best for: Understanding market structure
Key topics: Speed, fairness, technology arms race
Trading Psychology & Risk
7. "Thinking, Fast and Slow" - Daniel Kahneman
Level: Beginner
Focus: Behavioral economics
Best for: Understanding biases
Key topics: Cognitive errors, probability, decision-making
8. "The Black Swan" - Nassim Taleb
Level: Intermediate
Focus: Rare events & risk
Best for: Risk management mindset
Key topics: Tail risk, randomness, prediction limits
🏁 Kết Luận
Jim Simons' Greatest Insight
"We don't try to predict the market.
We try to find anomalies—tiny imperfections in the market's efficiency—
and exploit them systematically."
Not about:
- Being smarter than everyone
- Predicting the future perfectly
- Understanding "why" markets move
About:
- Finding small edges
- Executing consistently
- Compounding results
- Letting data speak
The Future of Trading
Trends:
1. AI/ML dominance:
- Deep learning models
- Neural networks
- Reinforcement learning
- Natural language processing
2. Alternative data:
- Satellite imagery
- Social media sentiment
- Web scraping
- IoT sensors
3. Quantum computing:
- Faster optimization
- Complex pattern recognition
- Portfolio construction
4. Democratization:
- More retail quants
- Open-source tools
- Educational resources
- Community collaboration
Your Journey Starts Now
Action steps:
Month 1: Learn
- Read "Quantitative Trading" by Ernest Chan
- Learn Python basics
- Understand financial markets
Month 2: Build
- Get historical data
- Backtest simple strategies
- Start paper trading
Month 3: Deploy
- Trade small real money
- Track everything
- Iterate & improve
Year 1: Master
- Develop multiple strategies
- Automate execution
- Build data pipeline
- Join communities
The math doesn't lie. The data doesn't have emotions.
Jim Simons proved that success in markets is not about luck or intuition—
it's about discipline, data, and systematic thinking.
Will you be the next quant success story?
Tìm Hiểu Thêm Về Quant Trading
Bootcamp Blockchain Mastery - Quant Trading Module
Muốn học quant trading từ zero đến hero? Tham gia Bootcamp Blockchain Mastery!
🎯 Module: Quantitative Trading & Algorithmic Strategies
1. Quant Trading Fundamentals
- Mathematical foundations
- Statistical arbitrage
- Time series analysis
- Probability theory for trading
2. Python for Quant Finance
- Pandas, NumPy for data analysis
- Matplotlib for visualization
- SciPy for optimization
- Statsmodels for econometrics
3. Strategy Development
- Mean reversion strategies
- Momentum strategies
- Pairs trading
- Market making
4. Backtesting & Validation
- Historical simulation
- Walk-forward analysis
- Monte Carlo methods
- Overfitting prevention
5. Machine Learning for Trading
- Feature engineering
- Model selection
- Cross-validation
- Ensemble methods
6. Risk Management
- Portfolio optimization
- Kelly Criterion
- VaR & CVaR
- Drawdown control
7. Execution & Infrastructure
- API integration
- Order management
- Latency optimization
- Production deployment
8. Real Projects
- Build 5+ trading bots
- Backtest on real data
- Deploy live (paper & real money)
- Portfolio of strategies
📞 Đăng ký ngay:
👉 Tìm hiểu thêm về Bootcamp Blockchain Mastery
Sau khóa học:
- Xây dựng trading bots riêng
- Hiểu quant trading professionally
- Career trong fintech/hedge funds
- Passive income từ algo trading
Bitget Trading Tools
Bạn đã sẵn sàng áp dụng quant strategies? Bắt đầu với Bitget!
Bitget cung cấp đầy đủ công cụ cho quant traders:
✅ Powerful API
- REST API cho trading
- WebSocket real-time data
- Low latency dưới 50ms
- Xem hướng dẫn API
✅ Trading Bots
- Grid Trading (tự động)
- DCA Bots
- Copy Trading từ top traders
- Custom bots via API
✅ Data & Analytics
- Historical data
- Advanced charts (TradingView)
- Real-time order book
- Market depth
✅ Derivatives
- Futures leverage 125x
- Adaptive Funding Rate (lowest costs)
- Cross/Isolated margin
- Hedge mode
👉 Đăng ký Bitget để start quant trading
Bài viết này được biên soạn bởi đội ngũ Hướng Nghiệp Công Nghệ. Inspired by "The Man Who Solved the Market" của Gregory Zuckerman. Để cập nhật thêm về quant trading, algorithmic strategies và fintech, hãy theo dõi blog của chúng tôi.
Tags: #QuantTrading #AlgorithmicTrading #JimSimons #MachineLearning #DataScience #TradingBots #Renaissance