Phương pháp kỹ thuật tinh gọn hiệu quả theo từng giai đoạn thị trường


Phương pháp kỹ thuật tinh gọn hiệu quả theo từng giai đoạn thị trường
Technical analysis là công cụ mạnh mẽ trong trading, nhưng cách áp dụng phải phù hợp với từng giai đoạn thị trường. Bài viết này trình bày các phương pháp kỹ thuật tinh gọn và hiệu quả cho từng phase của thị trường crypto.
Tại sao cần phương pháp theo giai đoạn?
Đặc điểm thị trường crypto
- High volatility: Biến động cao
- 24/7 trading: Giao dịch liên tục
- Multiple timeframes: Nhiều khung thời gian
- Market phases: Rõ ràng các giai đoạn
Vấn đề phương pháp chung
- Một method không phù hợp mọi phase
- Cần adapt theo điều kiện thị trường
- Giảm false signals
Giai đoạn 1: Accumulation (Tích trữ)
Đặc điểm giai đoạn
- Price action: Sideways, có thể giảm nhẹ
- Volume: Thấp
- Sentiment: Bearish, fear
- Duration: 1-2 năm
Phương pháp kỹ thuật
1. Support và Resistance Levels
Cách sử dụng:
Identify key support levels:
- Historical lows
- Psychological levels (round numbers)
- Fibonacci retracements

Strategy:
- Buy tại support với tight stop loss
- Accumulate tại nhiều support levels
- Don't chase breakouts
Indicators:
- Volume Profile: Xác định support/resistance
- Pivot Points: Daily/weekly pivots
- Fibonacci: 0.618, 0.786 retracements
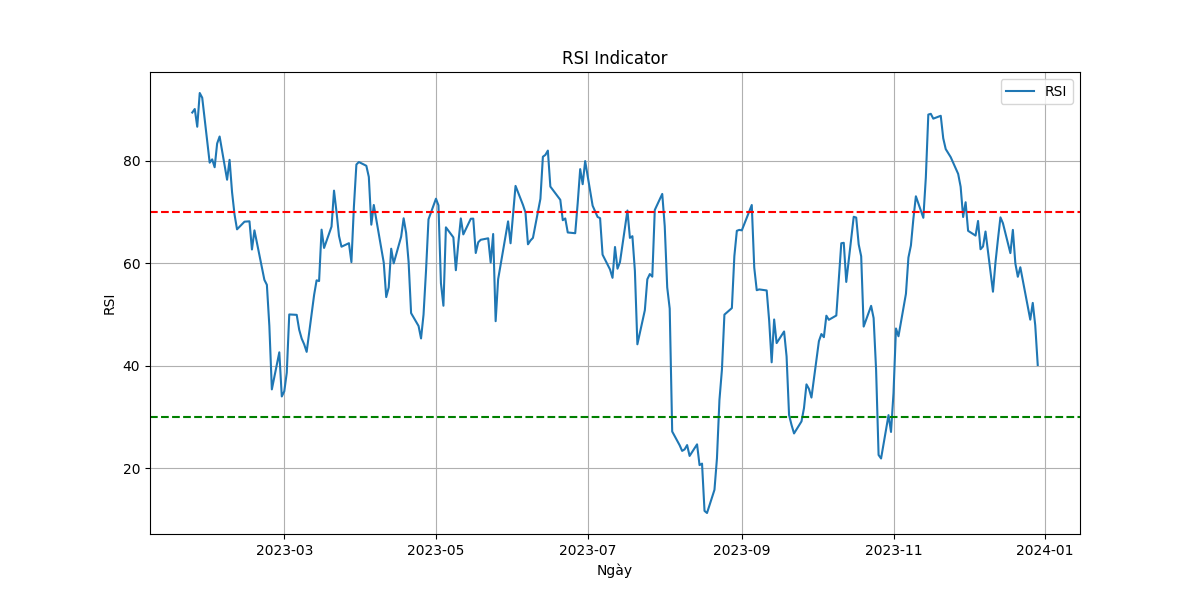
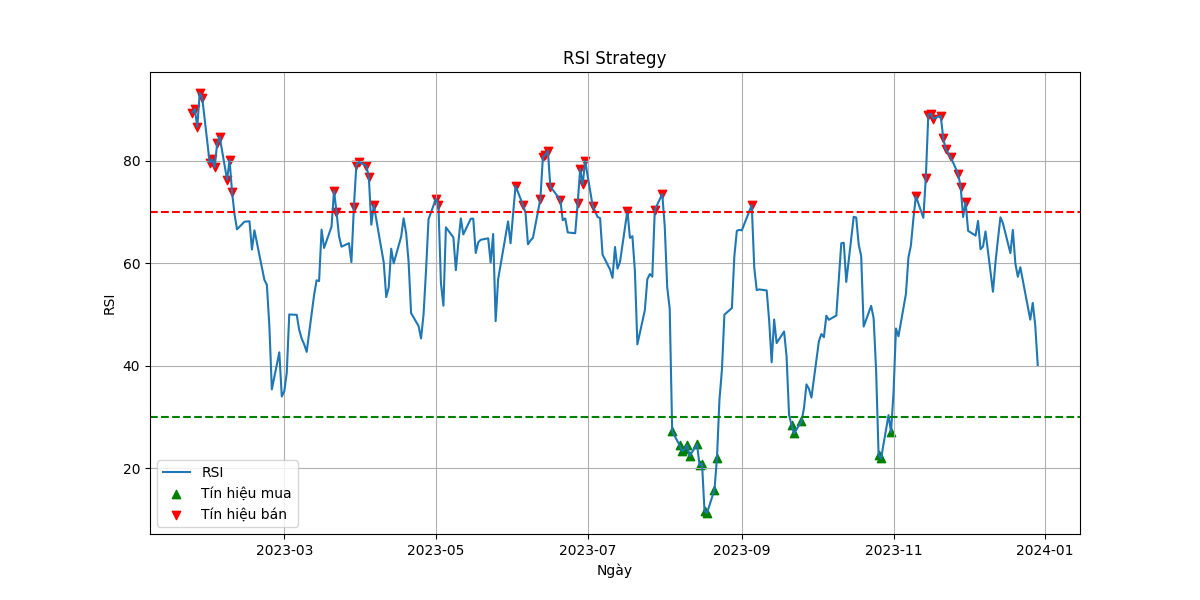
2. RSI Divergence
Bullish Divergence:
- Price tạo lower low
- RSI tạo higher low
- Signal: Potential reversal up
Cách trade:
- Wait for confirmation
- Enter khi RSI break trendline
- Stop loss below recent low
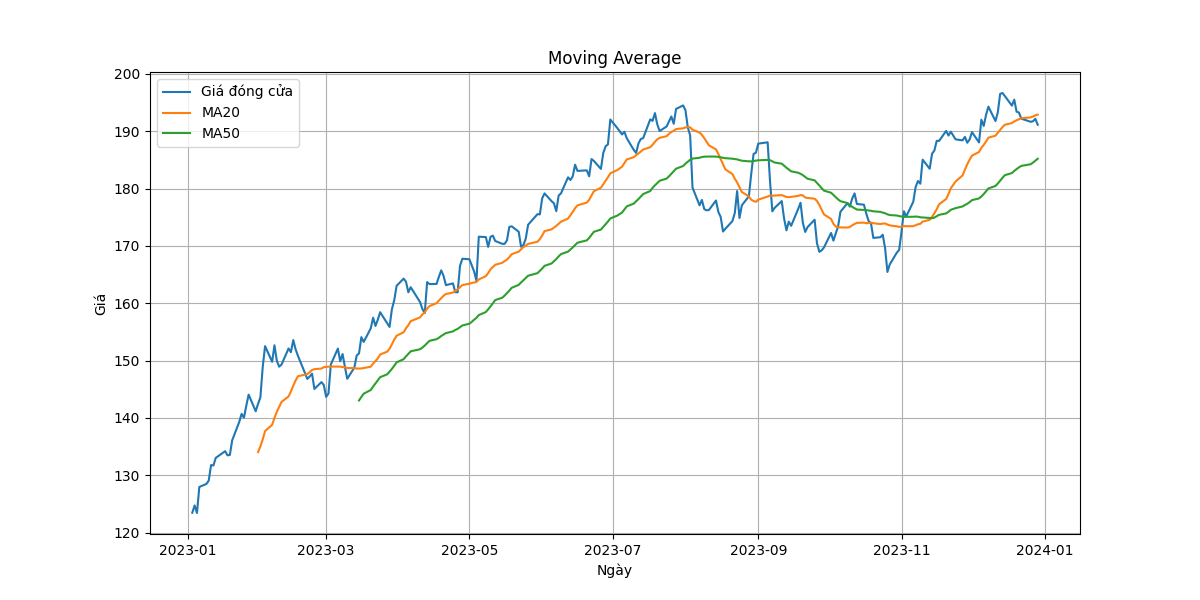
3. Moving Average Strategy
Setup:
- 200 EMA: Long-term trend
- 50 EMA: Medium-term
- 20 EMA: Short-term
Signals:
- Price trên 200 EMA → Uptrend potential
- Golden cross (50 vượt 200) → Bullish
- Price test 200 EMA → Buy opportunity
Risk Management
- Position size: Smaller (accumulating)
- Stop loss: 15-20% below entry
- Target: No specific target (long-term hold)
Giai đoạn 2: Mark-up (Tăng giá)
Đặc điểm giai đoạn
- Price action: Trending up
- Volume: Increasing
- Sentiment: Becoming bullish
- Duration: 1-1.5 năm
Phương pháp kỹ thuật
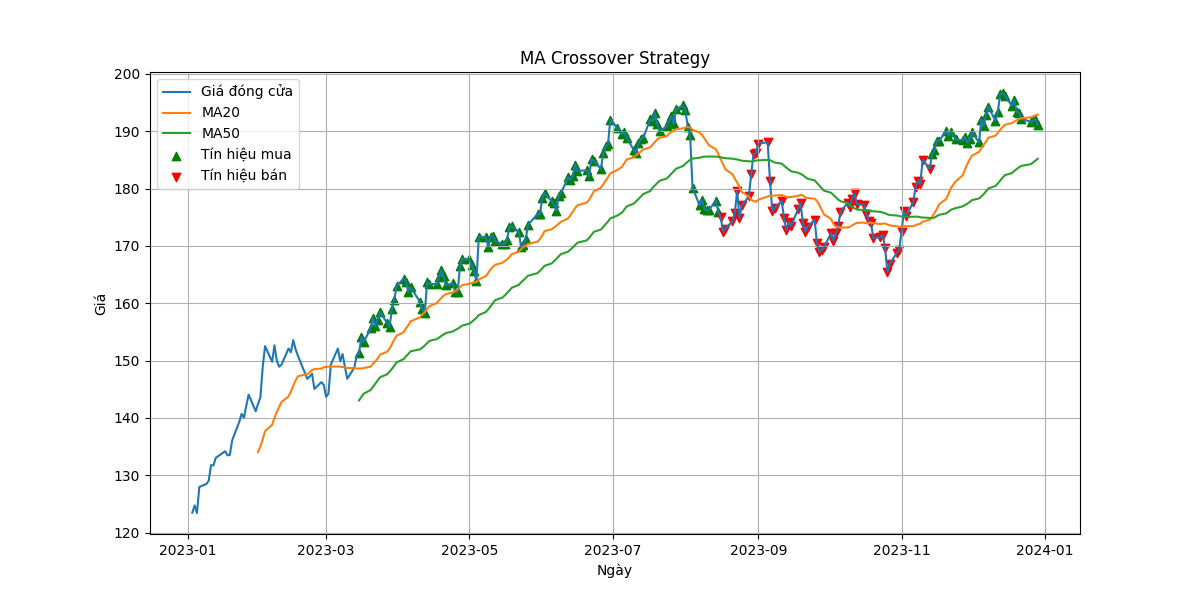
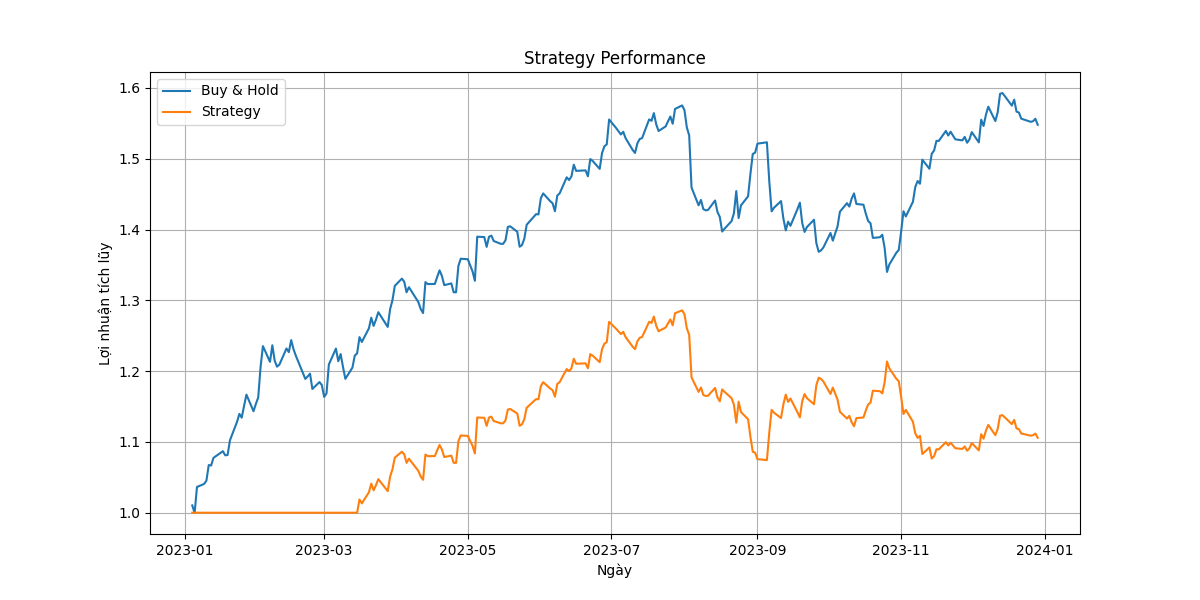
1. Trend Following
Moving Average Crossover:
Setup:
- Fast MA (20)
- Slow MA (50)

Signals:
- Golden Cross: Buy
- Price trên cả hai MAs: Hold
- Death Cross: Sell
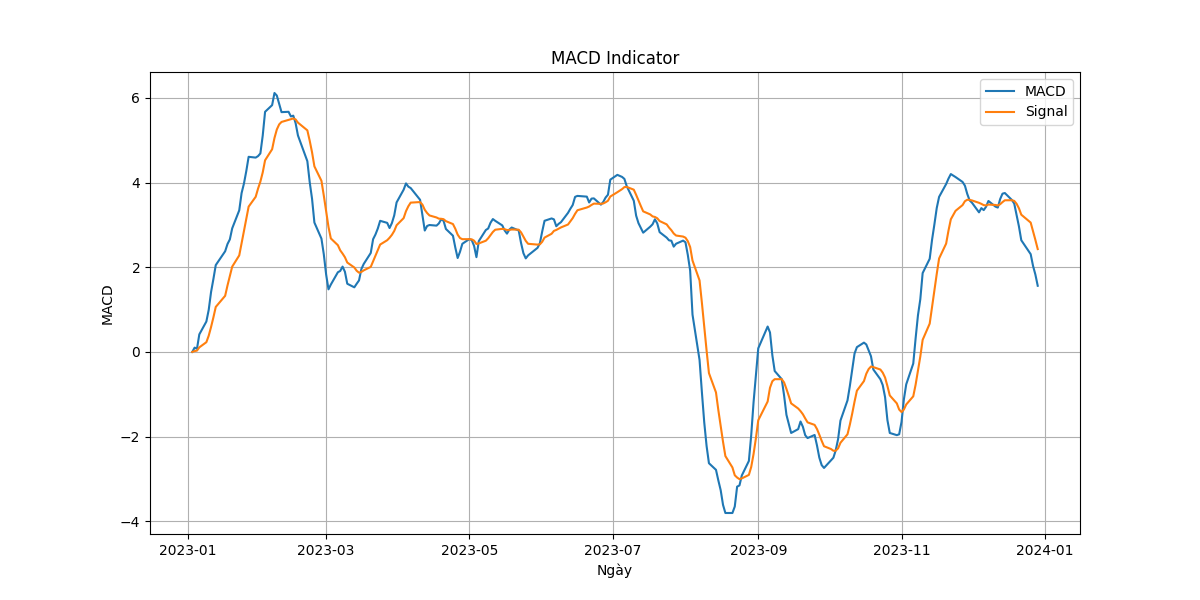
MACD:
- Histogram: Momentum
- Signal line cross: Entry/exit
- Zero line: Trend strength
2. Breakout Trading
Patterns:
- Ascending triangles: Bullish continuation
- Cup and handle: Breakout signal
- Flags and pennants: Continuation
Entry:
- Wait for volume confirmation
- Enter on breakout
- Stop loss below pattern
3. Fibonacci Extensions
Targets:
- 1.272 extension
- 1.618 extension
- 2.0 extension (aggressive)
Strategy:
- Take partial profit at each level
- Let runner continue
- Trail stop loss
Risk Management
- Position size: Normal to larger
- Stop loss: 10-15% below entry
- Take profit: Multiple levels (25%, 50%, 25%)
Giai đoạn 3: Distribution (Phân phối)
Đặc điểm giai đoạn
- Price action: Choppy, topping pattern
- Volume: High, but decreasing on rallies
- Sentiment: Extreme greed
- Duration: 6-12 tháng
Phương pháp kỹ thuật
1. Divergence và Reversal Patterns
Bearish Divergence:
- Price tạo higher high
- RSI/MACD tạo lower high
- Signal: Potential reversal
Reversal Patterns:
- Double top: Distribution
- Head and shoulders: Major reversal
- Rising wedge: Bearish
2. Volume Analysis
Volume characteristics:
- Decreasing volume on rallies
- Increasing volume on sell-offs
- Distribution pattern
Strategy:
- Reduce positions on high volume sell-offs
- Don't buy breakouts với low volume
- Watch for volume spikes
3. Resistance Levels
Key resistances:
- Previous all-time highs
- Psychological levels
- Fibonacci extensions
Strategy:
- Sell tại resistance
- Take profit aggressively
- Don't FOMO into new highs
Risk Management
- Position size: Reducing
- Stop loss: Tight (5-10%)
- Take profit: Aggressive (50-70% of position)
Giai đoạn 4: Mark-down (Giảm giá)
Đặc điểm giai đoạn
- Price action: Sharp declines
- Volume: High on sell-offs
- Sentiment: Extreme fear
- Duration: 1-2 năm
Phương pháp kỹ thuật
1. Capitulation Signals
Signs:
- Extreme RSI (dưới 20)
- Massive volume spike
- Gap down
- Everyone panic selling
Strategy:
- Wait for capitulation
- Don't catch falling knife
- Accumulate gradually
2. Support Hunting
Key supports:
- Previous cycle lows
- Major Fibonacci levels (0.618, 0.786)
- Psychological levels
Strategy:
- Buy tại support với volume
- Use small position sizes
- Multiple entries
3. Oversold Bounces
Indicators:
- RSI dưới 30
- Stochastic oversold
- Price far below MAs
Strategy:
- Quick bounce trades (scalping)
- Tight stops
- Don't hold long
Risk Management
- Position size: Very small initially
- Stop loss: Wide (20-30%) or no stop (DCA)
- Target: Long-term (accumulation)
Indicators theo giai đoạn
Accumulation Phase
Best Indicators:
- RSI (oversold)
- Volume Profile
- Support/Resistance
- Moving Averages (long-term)
Avoid:
- Momentum indicators (false signals)
- Trend following (no clear trend)
Mark-up Phase
Best Indicators:
- Moving Average Crossovers
- MACD
- ADX (trend strength)
- Volume (increasing)
Focus:
- Trend continuation
- Pullback entries
Distribution Phase
Best Indicators:
- Divergence (RSI, MACD)
- Volume analysis
- Reversal patterns
- OBV (On Balance Volume)
Focus:
- Reversal signals
- Volume confirmation
Mark-down Phase
Best Indicators:
- RSI (oversold)
- Support levels
- Volume (capitulation)
- Fibonacci retracements
Focus:
- Accumulation
- Value buying
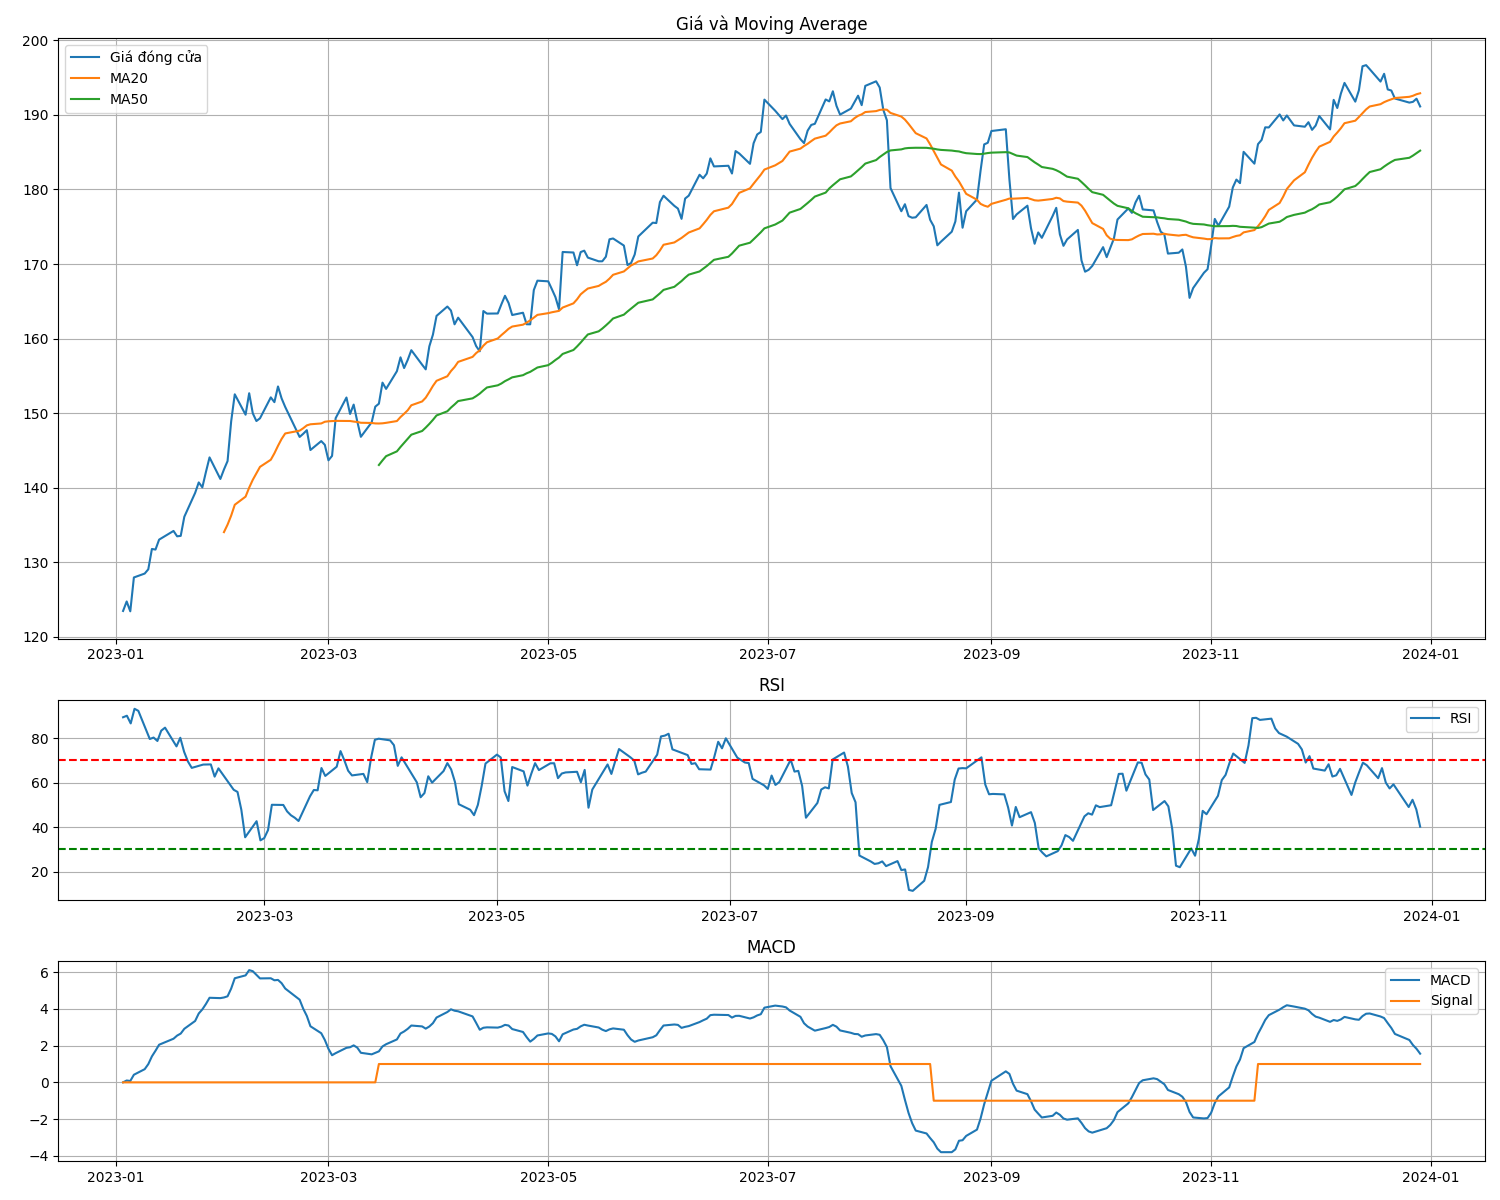
Multi-timeframe Analysis
Timeframe Hierarchy
Weekly/Daily:
- Determine overall phase
- Major trend direction
4H/1H:
- Entry timing
- Precise levels
15M/5M:
- Short-term trades
- Scalping
Example Setup
Weekly: Distribution phase → Reduce positions
Daily: Resistance at $50k → Sell zone
4H: Bearish divergence → Exit signal
1H: Break below support → Confirm exit
Common Mistakes
1. Using Same Method All Phases
- ❌ Dùng trend following trong accumulation
- ✅ Adapt method theo phase
2. Ignoring Volume
- ❌ Chỉ nhìn price
- ✅ Volume confirms signals
3. Overcomplicating
- ❌ Quá nhiều indicators
- ✅ Focus vào 2-3 indicators phù hợp
4. Fighting the Trend
- ❌ Short trong uptrend
- ✅ Trade with the trend
Tools và Platforms
Charting Platforms
- TradingView: Best for analysis
- CoinGecko: Quick charts
- DeFiPulse: For DeFi tokens
Indicators Library
- Built-in: RSI, MACD, MA
- Custom: Scripts on TradingView
- Volume: Volume Profile, OBV
Kết luận
Phương pháp kỹ thuật hiệu quả cần adapt theo từng giai đoạn:
- ✅ Accumulation: Support hunting, divergence
- ✅ Mark-up: Trend following, breakouts
- ✅ Distribution: Reversal patterns, divergence
- ✅ Mark-down: Capitulation signals, support
Key principles:
- Context matters: Phase determines method
- Volume confirmation: Always check volume
- Multi-timeframe: Confirm signals
- Simplify: Don't overcomplicate
- Discipline: Stick to your method
Nhớ rằng technical analysis là tool, không phải crystal ball. Kết hợp với fundamental analysis và risk management để có kết quả tốt nhất.
Bắt đầu áp dụng phương pháp kỹ thuật theo giai đoạn ngay hôm nay!